
Table of contents
This article covers a lot of ground and is broken into four main sections.
Here is a video outlining many of the concepts detailed below:
What to look for when using the Compare Runs graph
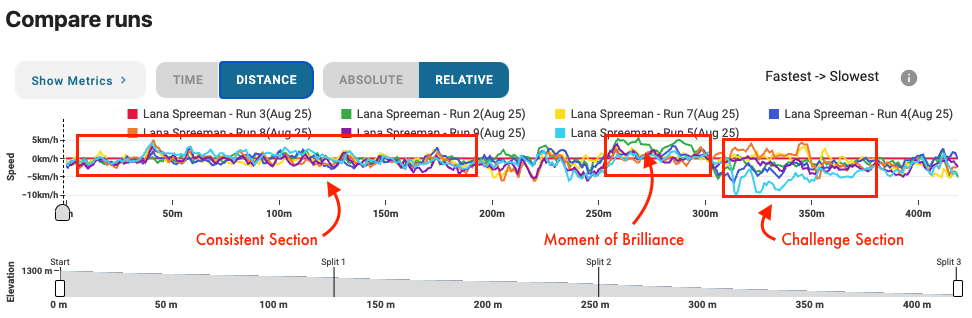
Challenge Sections
The primary purpose of the Compare Runs graph is to find where the speed varies significantly from run to run.
Speed often varies when there are changes in terrain (e.g. steep to flat), rhythm (e.g. delays), and challenging sets (e.g. off-camber turns).
We refer to these sections as Challenge Sections. The first step is to understand why these sections are challenging the athlete. This can involve asking the athlete and using video to review. Improving an athlete's consistency in these sections will result in a faster athlete
Moments of Brilliance
Moments of Brilliance are sections of a run that were significantly faster than the others. Sometimes this may be due to missing a gate, which can be verified by looking at the line in Protern or video, but sometimes it is when the athlete did everything right.
These Moments of Brilliance can occur on any run, including ones where the athlete did ski a clean run.
It is helpful to look for these Moments of Brilliance as they can be confidence boosting and informative for both the athlete and the rest of the team.
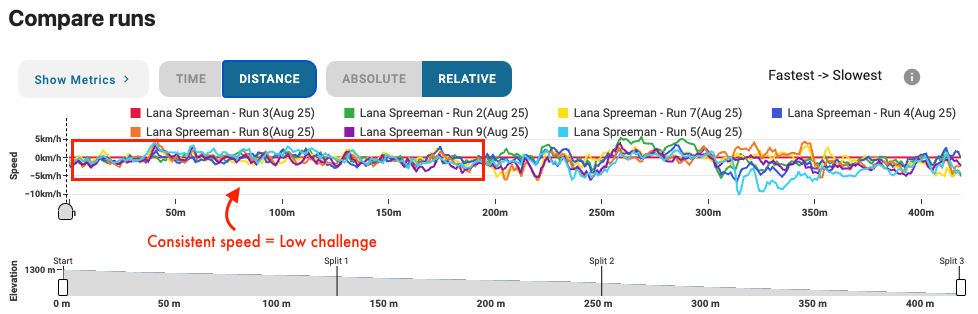
Consistent Sections
The opposite of Challenge Sections are Consistent Sections where all the runs have a very consistent and similar speed. These can be a sign of an easy course and unchallenged skier.
Use Compare Runs to validate that you are setting courses that challenge your athletes.
How to apply the insights from the Compare Runs graph
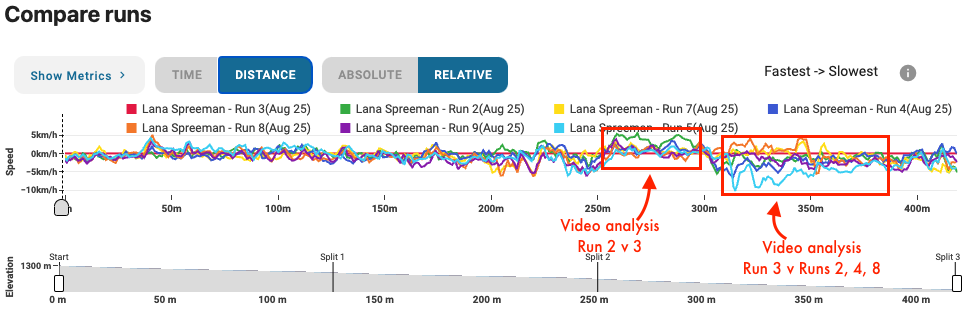
More efficient video analysis
Use Compare Runs to quickly find the Moments of Brilliance and Challenge Sections among all the runs. You can make a note of which runs to view, and what sections to focus on.
This process saves time for the coach, and provides a more focused review session with the athlete.
Objective athlete feedback - on-hill or after training
An athlete can easily see the impact of a Moment of Brilliance or Challenge Section on their speed in Compare Runs. Use the data to ask the athlete what they believe they did to cause the change in speed. This can happen on-hill and the change be applied right away, or in a debrief after training.
This method produces more introspective athletes and develops their SkierIQ.
Improvement opportunities for a team's fastest athlete
Traditional timing often can hold back the team's fastest athlete. They keep getting fast times and there is very little feedback on what they can do to be faster. It is not until they race an athlete who is faster than them before they truly understand their weak spots.
Even World Cup athletes will have Challenge Sections that can be identified and worked on. It is also possible that a slower athlete consistently outperforms the fastest athlete in one section. The whole team can learn from each other.
Use today's Compare Runs data to influence tomorrow's course
Compare Runs can show what section of today's course was too easy, a challenge or favoured a particular athlete. Coaches can take this insight and use it to plan the next day's training.
Similarly if the speed graphs are too consistent, then it may be worth increasing the challenge.
Best practices for selecting runs to compare
Below are some strategies for selecting runs that will provide the most insights.
Select three or more runs to see trends in the data
Comparing only two runs it is impossible to spot any patterns. By selecting three or more runs, it is possible to see trends such as Challenge Sections or Moments of Brilliance.
Select runs that have something in common
There are several strategies for picking common runs.
- All one athlete
Highlights the athlete's consistency. This method is also helpful if the athlete is trying different tactics. - All of the same run number (e.g. everyone's run 5)
Helpful if the conditions are changing and the athletes are similar in their abilities - Each athlete's best run
By comparing everyone's best run, you can highlight the Moments of Brilliance and see if there are strategies that can be shared among the athletes.
Benchmark against the overall fastest run
You can apply the strategies above and include the overall fastest run as a reference. Below is a video highlighting how beneficial it is to benchmark an athlete's runs against the fastest overall.
Consider DNF runs
Don't forget to look quickly at runs that did not finish. There can still be good insights right up until the athlete skied off course.
How to use the different views
Time axis
Time view will set the horizontal axis to time. This is helpful to see the impact of a tactic over the full run. You can move the slider across the speed graph to see how one run pulls away from another in a specific section. This is a great visual for athletes.
Distance axis
Distance view will set the horizontal axis to distance traveled. This will tell you the speed of that runs at each point on the course. This is helpful to show the exact difference in speed between runs. Use this view when the times are different enough that the runs no longer line up.
Absolute compare
Absolute compare shows total speed for all the runs. Use this to see how speed builds and how one run may continue accelerating for longer. You can also see the maximum and minimum speeds achieved and where.
Relative compare
Relative compare will set the fastest run as zero and all the other runs will be difference in speed at that point time or distance, depending on the view selected. This view is very helpful to see differences when the speeds are high and/or consistent.