Protern allows coaches to be far more efficient in their video analysis process. With 5,000 datapoints from Protern on every run, it is possible to identify which sections of which runs deserve attention.
- Use the Analyze Runs function
Select all of one athlete's runs and use the Analyze Runs function to see, in detail, what happened in the runs. - Look for areas of variance
When looking at the speed graph, look for areas where the speed varies significantly. By selecting Distance and Relative it can highlight where more easily these areas.
In the graph below, there are two sections to focus more attention: Run 2's moment of brilliance around 260m into the course and the large variance in speed from 310m to 390m on the course.
The speed from the start to 175m is consistent enough to ignore for video analysis.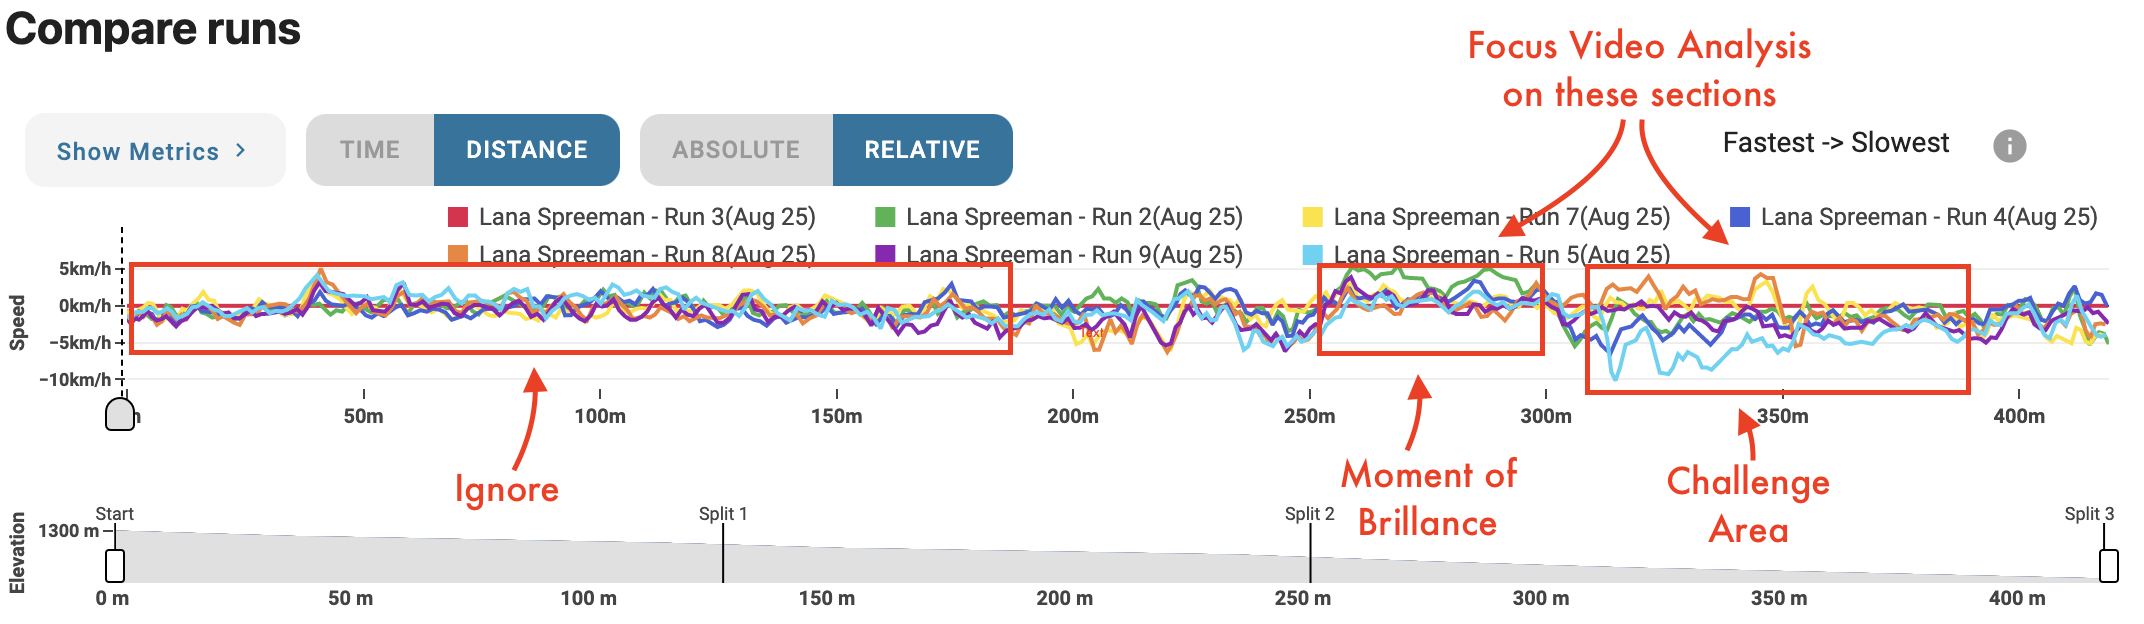
- Sync data to only the most important runs
Save time and only sync the Protern data for the runs that were most important. These runs may, or may not, be the fastest for the day. By using Analyze Runs, you may find that a slower overall run had a very strong approach into a combination.