Protern's CSV downloads allow for linking the data collected with video.
Tip: To make videos like the ones in the screenshots below, download the predefined Telemetry Overlay patterns at protern.io/downloads
Speed
Speed is the most common metric displayed on the video. The value can be shown as a graph or a speedometer. For either view, it is helpful to compare two videos to see the actual speed difference in different sections.
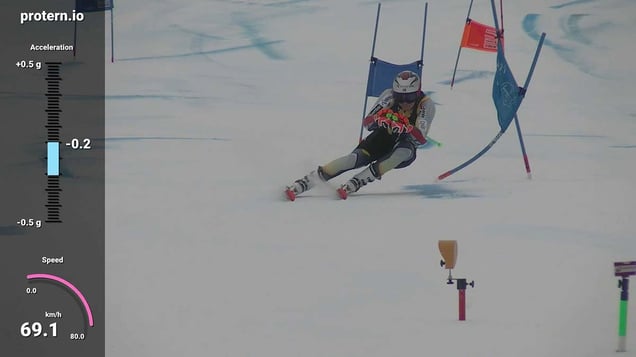
Acceleration
Acceleration data shows how much the skier speeds up and slows down during the run. This, paired with speed, gives the athlete an objective measurement of the impact of a tactic or technique.
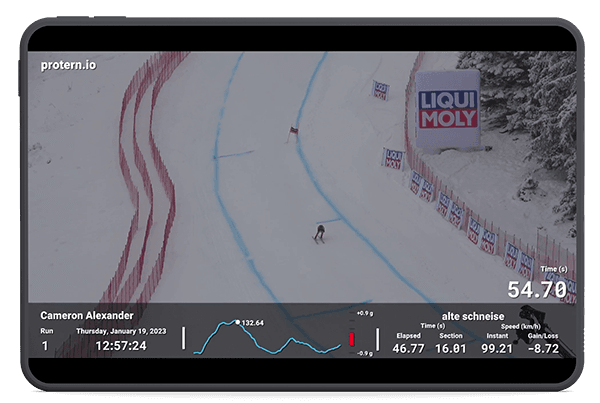
Quantriq Splits and Time
Adding the quantriq splits and time to video, can make the enhanced video analysis even more powerful. The resulting videos are almost like World Cup TV coverage, but with unlimited number of splits and placed wherever you want. It is also possible making different quantriqs that analyze different sections of the course. In this scenario, you may opt to make more more than one video using different data.
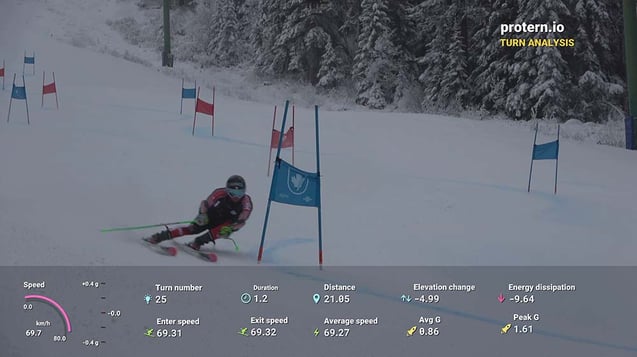
Turn Data
Protern can generate a number of turn related metrics, including average g-force, energy dissipation, and entry and exit speed among others. This level of video integration can helpful for more in-depth analysis sessions rather than everyday analysis.