Using patterns to display different data in Telemetry Overlay
Telemetry Overlay lets you save predefined patterns of gauges and data for your data. Protern has created a few different that can be used as is, or modified.
In order to show quantriq split data, turn data, or your own custom set of data, you need to use a pattern in Telemetry Overlay. This article will show you how to load in a new pattern and change your the default pattern.
This article will cover the following:
- Protern patterns
- About the Protern data in the patterns
- Loading a new pattern in Telemetry Overlay
- Changing the default pattern in Telemetry Overlay
Protern Patterns
Protern has created three pre-defined patterns that uses data from the Download Runs CSV. The patterns can be downloaded from the Protern Downloads page.
- Basic speed and acceleration
This is the default Protern pattern included with Telemetry Overlay.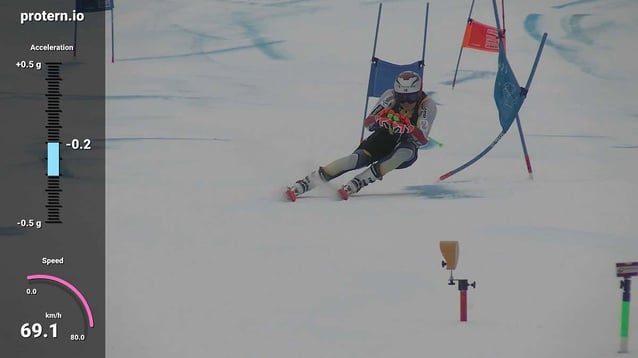
- Quantriq splits
This pattern leverages the data from the quantriq, including the run information, and split timing and speed data.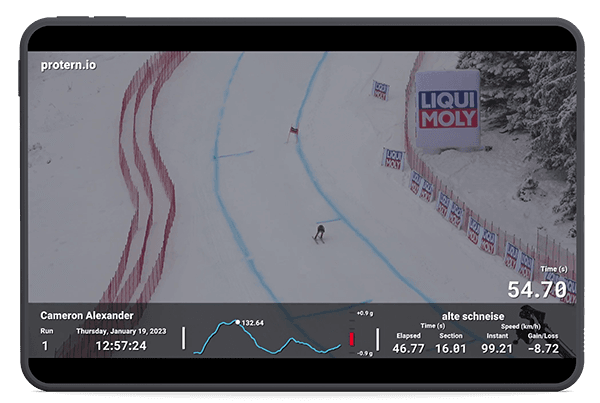
- Compare to fastest
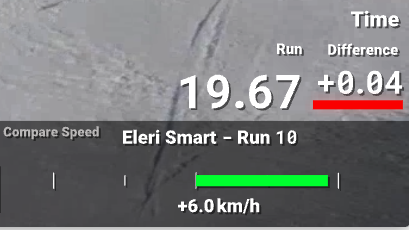
The compare to fastest pattern will show the time and speed difference from the fastest run of the quantriq in real time.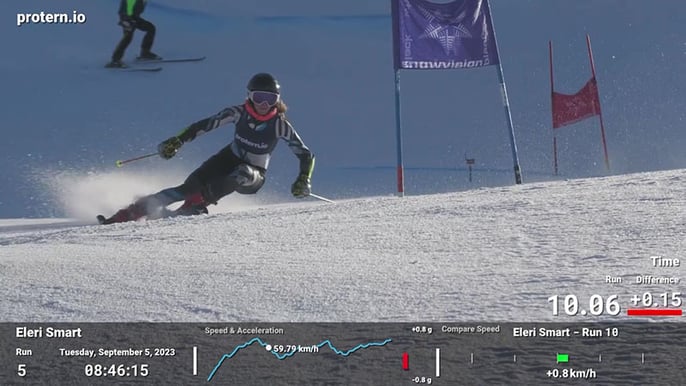
- Turn analysis
The turn analysis pattern includes all the turn data for deeper analysis.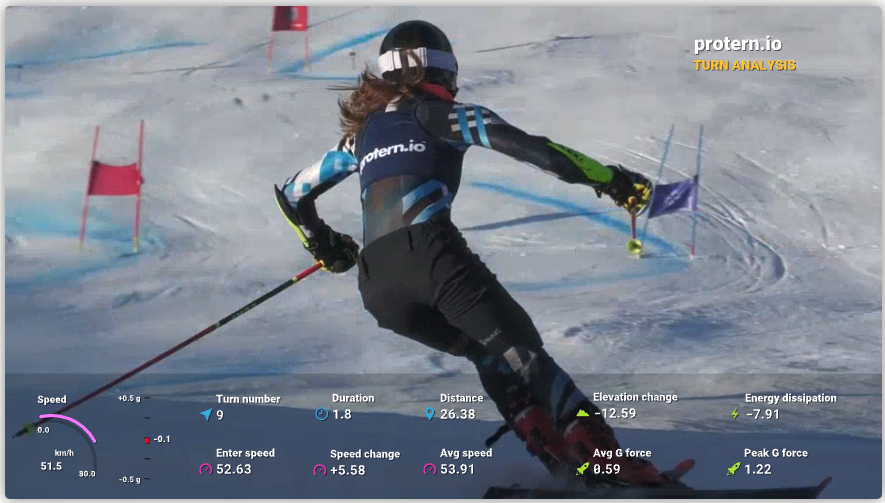
About the Protern Data
The graphic elements overlayed on the video in the patterns above are called gauges in Telemetry Overlay. Below is a description of each of the gauges and what information they provide.
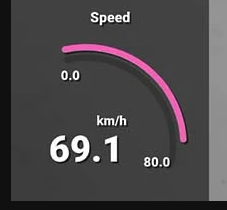
Speedometer
Found in: Basic and Turn Analysis pattern
The speedometer will show the current speed of the athlete.
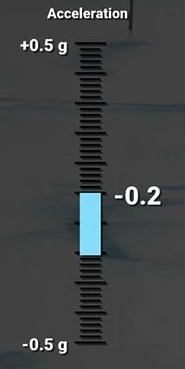
Acceleration
Found in: All Patterns
The acceleration gauge is available in all the patterns. It will show the rate at which the athlete is speeding up or slowing down. Use this gauge to see if the athlete is able to accelerate through a turn. Keep in mind that on a steep slope, it could still be possible to accelerate even if the athlete is sliding a turn because of gravity.
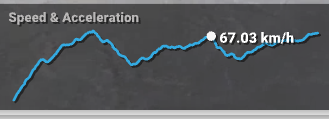
Speed graph
Found in: Quantriq splits and Compare to Fastest pattern
The speed graph includes the current speed as text, as well as the chart of their speed through the video. This graph is very useful to see the jumps and dips in speed (i.e. acceleration and deceleration) through the run. It is possible to spot patterns where dips happen on certain turns, or to visualize the acceleration as a result of a specific line.
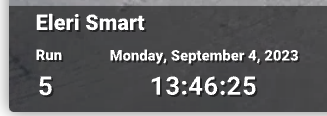
Athlete information
Found in: Quantriq splits and Compare to Fastest pattern
The athlete information section will include the athlete name, run number and time of day of the run. This information comes from the quantriq, so be sure to remove any inspection runs or slips to have an accurate run number.
Telemetry Overlay will default to showing the time of day in the timezone of your computer. This won't be an issue unless you are processing video in a different timezone from where the filming occurred. You can adjust the time zone by clicking the time gauge and modifying the timezone on the right gauge panel.
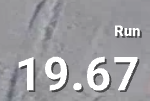
Running time
Found in: Quantriq splits and Compare to Fastest pattern
Running time is the time from the start of the quantriq. You can use this gauge when comparing multiple athletes in two ways:
- Line up the videos to compare at a specific point on the course and see the time difference; or,
- Line up the videos to compare using the same time (e.g. 10.00s) to see where each athlete is on the course at the same time.
Quantriq splits
Found in: Quantriq splits pattern
The quantriq splits pattern will get the time and speed data from your quantriq. The time elements include the time since the start of the quantriq (i.e. elapsed time) and the time since the last split (i.e. section time). The speed elements include the speed when the athlete crosses the split (i.e. instant speed) and the gain or loss in speed from the last split (i.e. speed gain/loss).
The quantriq splits can be useful if you are doing some specific analysis, such as entry and exit speed into a feature (e.g. combination, flat section, berm in ski cross, etc).

Speed and time difference
Found in: Compare to Fastest Pattern
This pattern will show the difference in time and speed from the fastest run in the quantriq. The difference is calculated every 0.5s for that exact location. The fastest run has the athlete name and their run number.
This pattern useful to see the direct impact on the speed and time as a result of a line, tactic or technique choice.
Turn metrics
Found in: Turn Analysis Pattern
The turn metrics is a beta feature that works best for GS. Protern can detect each turn show the statistics for each turn. This includes:
- Number, duration and distance of the turn
- Entry, speed change between the entry and exit and average speed for the turn
- Average and peak lateral G forces for the turn
- Elevation change and energy dissipation (beta metric) of the turn

Loading a new pattern in Telemetry Overlay
Here are the steps to change the pattern in Telemetry Overlay:
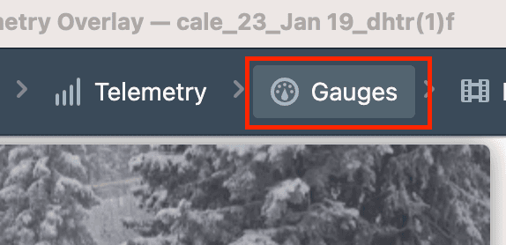
- Click on Gauges on the top bar within Telemetry Overlay
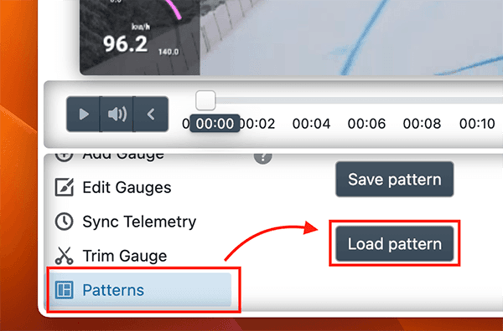
- At the bottom left, scroll down and click Patterns, then Load Pattern
- Click Load in the Load saved Pattern popup
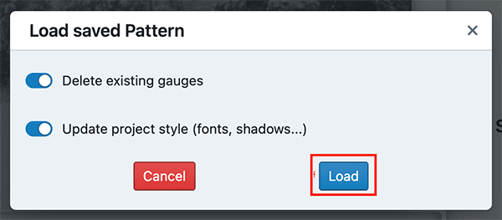
- Select the pattern and click Open
Changing the default pattern in Telemetry Overlay
Changing the default pattern is helpful if you are regularly use a different pattern.
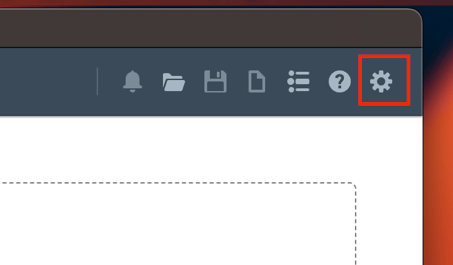
- In Telemetry Overlay click the gear icon to open the settings menu
- In the Settings menu scroll down to Default Pattern
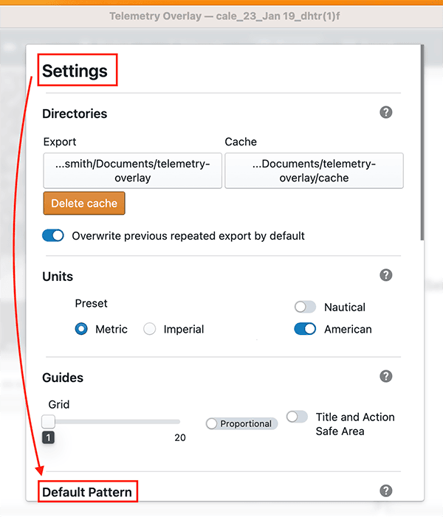
- Select protern.io and click the Custom Pattern button

- Select the pattern file you want as the default