Quantriq page basics
Here we will break down the different parts of the quantriq page.
The quantriq page includes the following core sections:
Quantriq detail section
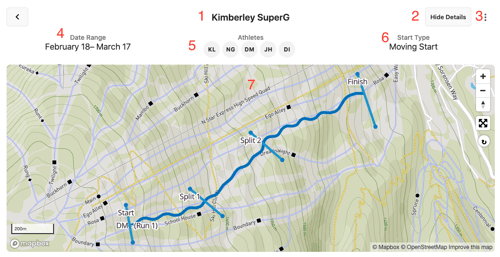
The quantriq details section includes the information that was used to build the quantriq.

- Quantriq name: The name set for the quantriq
- Hide Details: Button to hide the details and maximize the data view
- Menu: Includes edit, copy, delete, print and download functions
- Date range: Protern.io will search for data that occurred between these two dates
- Athletes: Initials of the athletes whose data is data will be included in the quantriq
- Start Type: How Protern.io starts its timing
- Reference run and splits: Protern.io will show an example run along with the splits made in the quantriq builder
Note: An athlete may be included in the quantriq details, but if they didn't pass through the splits in the given date range, their data will not appear in quantriq.
Quantriq data section - control bar
Below the map in the quantriq detail section lies the control bar for the all the data in the quantriq.

- Filter results: Only show data for certain athletes and/or occurred over a specific time
- Group by: Group the data by athlete, run number, date or none (shown)
- Show metrics: Depending on the data collected, you can display speed, heart rate, distance, power, etc for each run
- Display columns: You can optimize your view by showing or hiding certain columns, including the splits and time of the run
- Compare runs: Select some runs and compare their speed, line and, if the source data includes the information, power and heart rate
- Time hero graph: For selected runs, see how much time was lost between each split
- Geo hero graph: See on a map which of the selected runs was the fastest for each section
Quantriq data section - run data
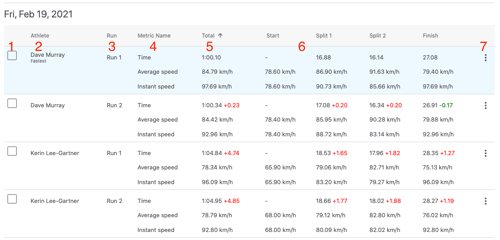
All the data for a quantriq lives here.

- Select box: Click anywhere on the row to select a run for the Compare Runs, Time Hero and Geo Hero functions
- Fastest/Latest tag: The fastest run will be highlighted in blue and the latest will be highlighted in green
- Run number: Runs are automatically counted for the day
- Metric name: This column will appear automatically when more than the time is shown
- Total column: The total value for a run. This will be the final time for the run, total average for the run, or the last instant value
- Split sections: Time and average metrics are for the section between the two splits. Instant metrics include the values at the split itself.
- Run option menu: This will open a window with all the run data, section data for video integration, and ability to delete a run
Tip: If no runs appear when you made a quantriq, it could be for several common reasons that are easy to fix. Learn more about quantriqs with no runs.