Include Protern.io data, such as speed, into Dartfish - one of the most powerful sport video analysis tools available.
Tip: Use Protern Clock LTC Generator iOS app or Dish device to record videos with Universal Coordinated Time (UTC) embedded in the video for automatic and extremely accurate syncing of video and data. Learn more about automatic linking of video and Protern data.
Before you start, you will need the following:
- Dartfish Pro S
- (Optional) Template to include Protern.io speed (downloads)
- Video of a run (tips for filming a run to embed data)
- Run data from Protern.io (how to download run data)
This article will cover the following steps:
- Importing the Protern data file into Dartfish
- Synchronizing the Protern data with video
- Importing a Protern template into Dartfish
- Creating your own template in Dartfish with Protern speed data
Importing the Protern data file into Dartfish
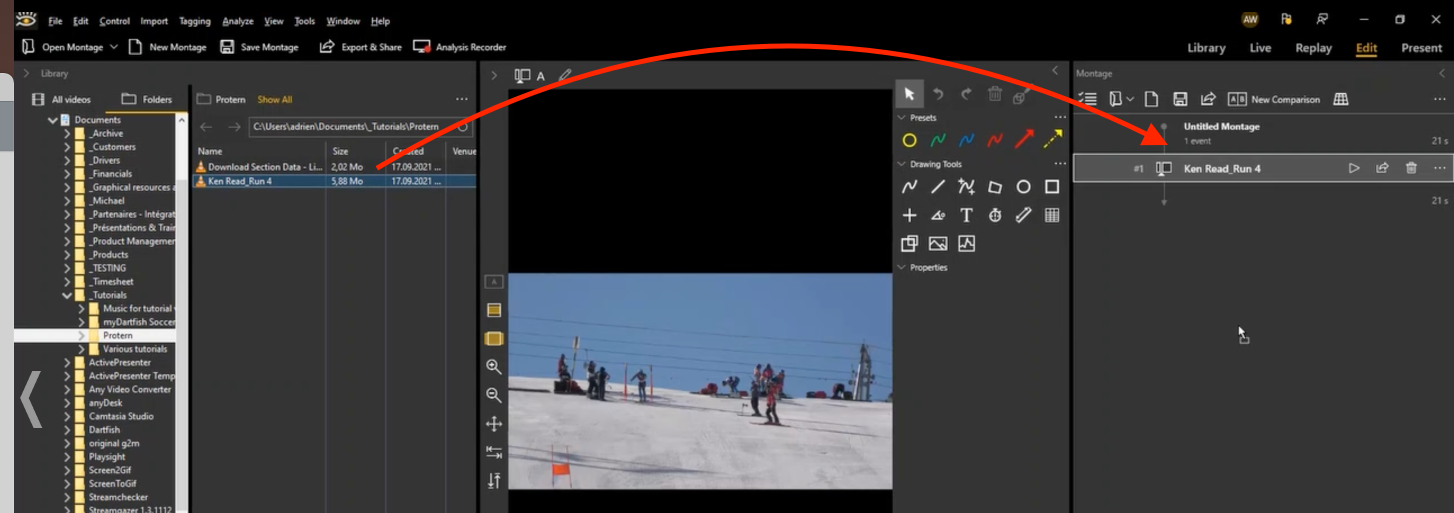
- Go to Edit Workspace, open the library, and add the video of the run to the montage
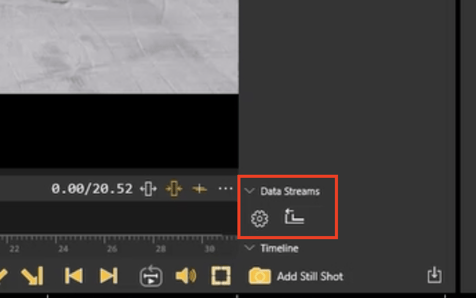
- Under Data Streams, click on Manage External Data and select the run data from Protern.io
- Ensure the checkbox First row contains column headers is clicked and click next
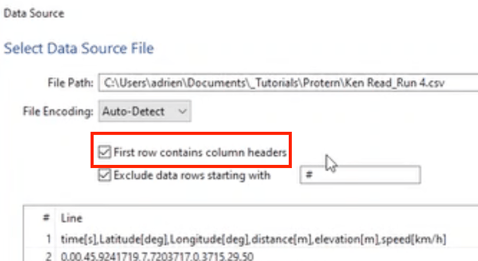
- Ensure the Delimiter is set to Comma and click next
- Set Timestamp Source to From Column and time[s] and Time Format to Seconds
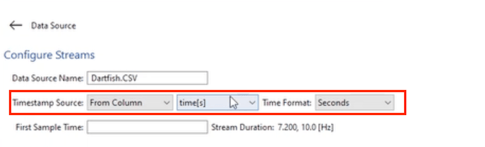
- Click Apply and Close
Synchronizing Protern data with the video using Dartfish
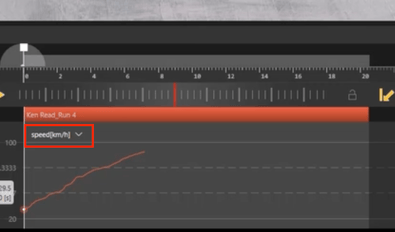
- Select the data to display in the graph
- Play the video until the athlete reaches the point where the quantriq data starts (see Setting a landmark in the article, Tips for Filming).
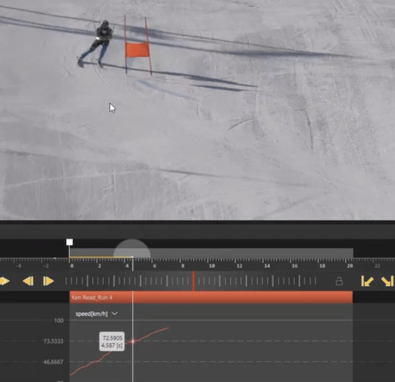
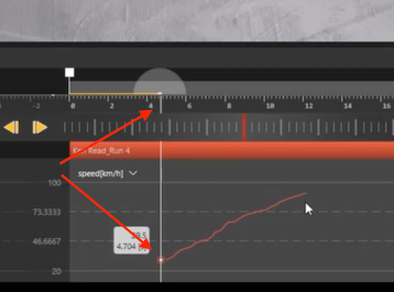
- Drag the start of the data stream so that aligns with the playhead
Importing a Protern template into Dartfish
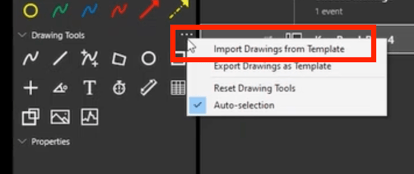
- In the Drawing Tools bar, click the three dots and select Import Drawings from Template
- Unzip and select the template downloaded from the Protern.io Downloads page
Creating your own template in Dartfish with Protern speed data
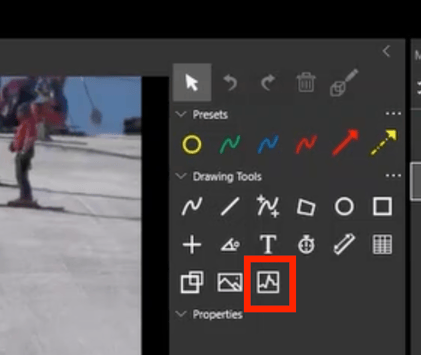
- Select the graph drawing tool
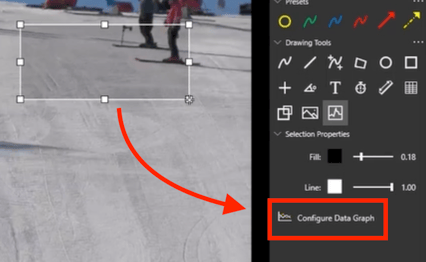
- Place the graph on the video and click Configure Data Graph
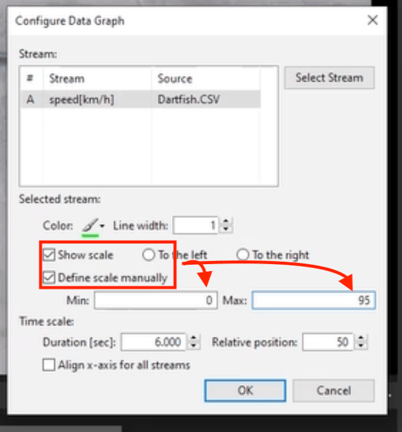
- Select speed[km/s] and press ok
- Click Show scale, Define scale manually and set the maximum to approximately 10km/h faster than the max speed, and click ok
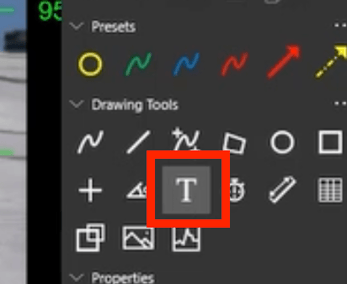
- To add the current speed value, click the text box
- Right click the text box and select External Data Display
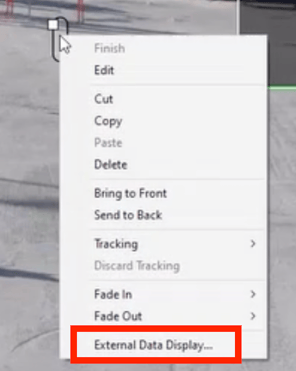
- Select speed[km/h] in Data Stream